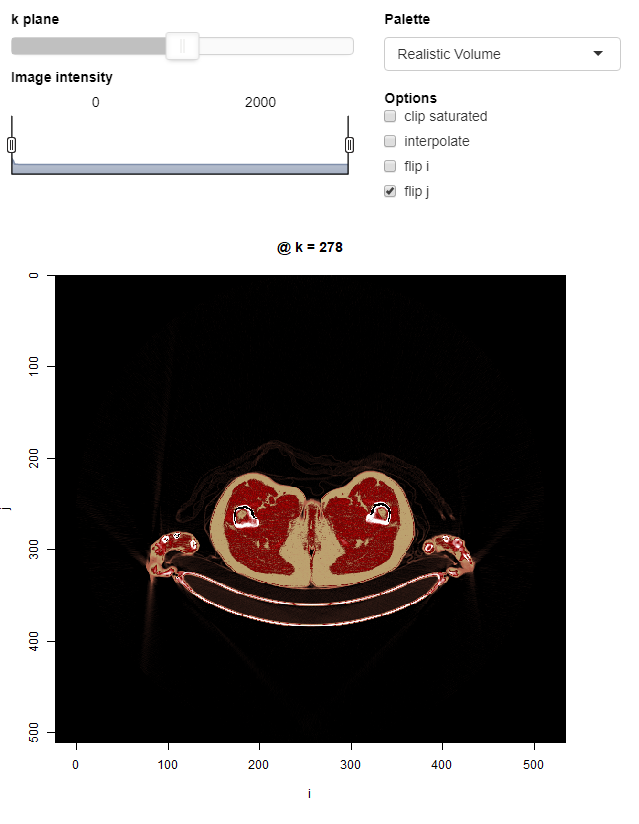
How to create an interactive shiny display?
[1] Winston Chang, Joe Cheng, JJ Allaire, Carson Sievert, Barret Schloerke, Yihui Xie, Jeff Allen, Jonathan McPherson, Alan Dipert and Barbara Borges (2021). shiny: Web Application Framework for R package version 1.7.1. https://CRAN.R-project.org/package=shiny
[2] Dan Vanderkam, JJ Allaire, Jonathan Owen, Daniel Gromer and Benoit Thieurmel (2018). dygraphs: Interface to ‘Dygraphs’ Interactive Time Series Charting Library. R package version 1.1.1.6.
https://CRAN.R-project.org/package=dygraphs
library (espadon)
library (shiny)
library (dygraphs)
library (shinyWidgets)

shiny.display <- function (vol, width = 600) {

  breaks.k <-  vol$k.idx
  range.k <- range (breaks.k)
  H <- histo.vol(vol, breaks = seq (floor (vol$min.pixel) - 0.5, ceiling (vol$max.pixel) + 0.5, 1))
  H[["density"]] <- round (H[["counts"]] / sum(H[["counts"]]),4)
  db <- do.call(cbind.data.frame,H[c("mids","density")])
  rgI <- range (db$mids)

  ui <- fixedPage (
    fixedPanel(
      top=10,
      left=20,
      width = width+10,
      fixedRow(
      column(7,
             h5(HTML("<b>k plane</b>"), style = "color: #000000; text-align: left;"),
             if (range.k[1]!=range.k[2])
                noUiSliderInput ("k_slider", label = NULL, min = range.k[1], max = range.k[2], step=1,
                                 value = breaks.k[ceiling (length(breaks.k)/2)], update_on="end",
                                 tooltips =FALSE, color ="#C0C0C0",width = "auto"),
             h5(HTML("<b>Image intensity</b>"), style = "color: #000000; text-align: left;"),
             dygraphOutput("Iplot", height="80px")),
      column(5,
             h5(HTML("<b>Palette</b>"), style = "color: #000000; text-align: left;"),
             selectInput ("pal", label = NULL, choices = list("Grey palette"="Gpal",
                                                              "Realistic Volume" ="RVVpal")),
             h5(HTML("<b>Options</b>"), style = "color: #000000; text-align: left;"),
             checkboxGroupInput("option", label = NULL, inline = FALSE,
                                choices = c("clip saturated" ="cs", "interpolate"="inter",
                                            "flip i" = "abs.flip","flip j" = "ord.flip"))

      )),
      fixedRow(plotOutput("plot", height = paste0(width,"px"), width = paste0(width,"px")))
    )
  )

    server <- function(input, output, session) {
      session$onSessionEnded (function() {stopApp()})
      Islider <- reactiveValues (min = rgI[1], max = rgI[2])

      observeEvent(input$Iplot_date_window,{
        Islider$min<-isolate(input$Iplot_date_window)[[1]]
        Islider$max<-isolate(input$Iplot_date_window)[[2]]
      })

      output$Iplot <- renderDygraph({
        dygraphs::dygraph(db)%>%dyRangeSelector(height = 60, retainDateWindow = TRUE) %>%
          dyOptions (drawPoints = FALSE, drawYAxis = FALSE, drawGrid = FALSE,
                     timingName = FALSE, colors = "#FFFFFF") %>%
          dyRebase (percent = TRUE)
      })

      output$plot <- renderPlot({
        option <- input$option
        if (input$pal == "Gpal") {
          col <- grey.colors(1000, start = 0, end = 1)
          min <- Islider$min
          max <- Islider$max
        } else {
          col <- pal.RVV(1000)
          min <- -1000
          max <- 1000
        }
        if (is.null(input$k_slider)) k <- range.k[1]
        else k <- input$k_slider
        display.kplane(vol, k = k, col = col,
                       breaks = seq(min, max, length.out = 1001),
                       interpolate = "interp" %in% option, sat.transp = "cs" %in% option,
                       abs.flip = "abs.flip" %in% option, ord.flip = "ord.flip" %in% option)
      })
    }

    shinyApp(ui, server)
}
If CT is an espadon object of class “volume”, it is then sufficient to execute the following instruction:
shiny.display (CT)