Visualization of imaging volumes is essential for controlling the loaded DICOM objects. The espadon package allows this display, with the possibility of using the color palettes of your choice.
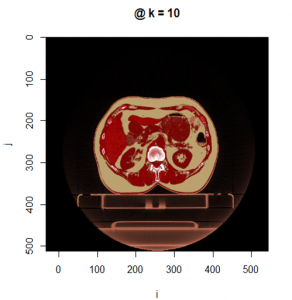
The display.kplane() function displays a slice plane of the imaging volume in the slice plane geometric frame of reference.
CT <- load.obj.from.dicom(ct_dicom_file_path, data = TRUE)
display.kplane (CT, k =10, col = pal.RVV(1000),
                breaks = seq(-1000, 1000, length.out = 1001),
                ord.flip = TRUE, interpolate = TRUE)
Slice display of the CT, with the palette developed by Silverstein & al [1].
[1] Silverstein JC, Parsad NM, Tsirline V (2008). “Automatic perceptual color map generation for realistic volume visualization.” Journal of Biomedical Informatics, 41(6), 927-935. ISSN 1532-0464, doi: 10.1016/j.jbi.2008.02.008.
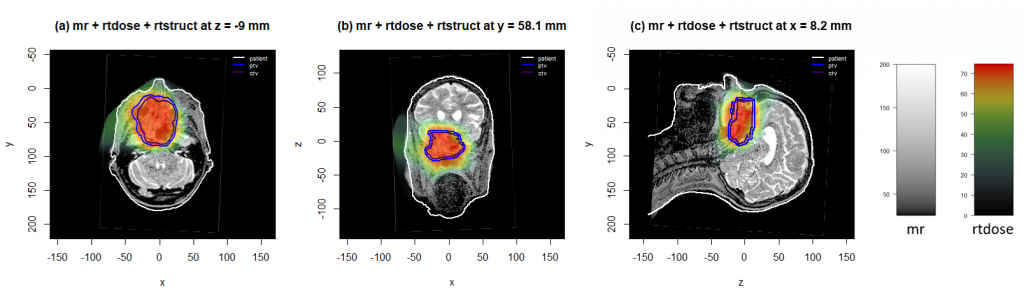
The display.plane() function displays transverse, frontal or sagittal views in the patient’s frame of reference. It allows the superposition of images and contours.
# pat.dir is the patient directory containing the DICOM files for a MR, an RT-dose and an RT-struct, and a REG file to link RT-dose and MR frames of reference.
patient <- load.patient.from.dicom(pat.dir, data = TRUE)
D <- load.obj.data(pat.f$rtdose[[1]])
S <- load.obj.data(pat.f$rtstruct[[1]])
MR <- load.obj.data(pat.f$mr[[1]])

# Maximum dose coordinates
Max.dose.coord <- get.xyz.from.index (which(abs(D$vol3D.data-D$max.pixel)<1e-3), D)[1,]

# Display in the frame of reference of RT-dose
display.plane(bottom = MR, top = D, struct = S, view.type = "trans",
              view.coord = Max.dose.coord[3], display.ref = D$ref.pseudo,
              T.MAT = pat.f$T.MAT)

display.plane(bottom = MR, top = D, struct = S, view.type = "front",
              view.coord = Max.dose.coord[2], display.ref = D$ref.pseudo,
              T.MAT = pat.f$T.MAT)

display.plane(bottom = MR, top = D, struct = S, view.type = "sagi",
              view.coord = Max.dose.coord[1], display.ref = D$ref.pseudo,
              T.MAT = pat.f$T.MAT)
Transverse (a), frontal (b), and sagittal (c) views of the overlay of MR, rt-dose and part of rt-struct RoI (regions of interest), in the frame of reference of rt-dose and rt-struct, displayed using the display.plane function. The display.palette function is used to display palettes.
It is also possible to use the plot() function, which can display objects of class volume (for CT, MR, RT-dose for example), objects of class struct (for RT-struct) and those of class mesh.